
Background
This blog post discusses my most recent research in a series of experiments that I hope to publish academically soon. A good place to get some context on what I’m talking about is the first article in the series: Identifying Turmoil in Social Networks With Graph Anomaly Detection. In particular, you should check out the section Methodological details for graph anomaly detection, as the discussion below presupposes familiarity with the procedure described there.
Procedure
Last week, I described a bipartite projection that produces a graph model whose edges can be interpreted as binomial probabilities. These probabilities are represented by a number of successes (in the particular example from last week, the count of mutual users) and a number of total trials (the total number of active users for a particular subreddit). By performing this projection over a series of time slices of a dynamic graph (i.e. a graph with a time component) we get a series of binomials associated with each edge over time. This lends itself very nicely to the problem of anomaly detection: in the case of the social network I am studying (reddit), I am particularly interested in unusual spikes of activity across the graph, and these “spikes” have a very straight-forward interpretation at the edge level when we apply this binomial framework.
For each edge in the “current” time slice of the graph we are interested in, we infer the expected activity by summing up the successes and trials associated with that edge over a window of time slices of the recent past. This gives us a “baseline” proportion. We can then identify edges that exhibit statistically significant increases in activity by invoking a simple test for difference in proportions. We then filter each time to statistically significant edges, forming a graph that specifically models significant increases in activity.
Results
Qualitative performance
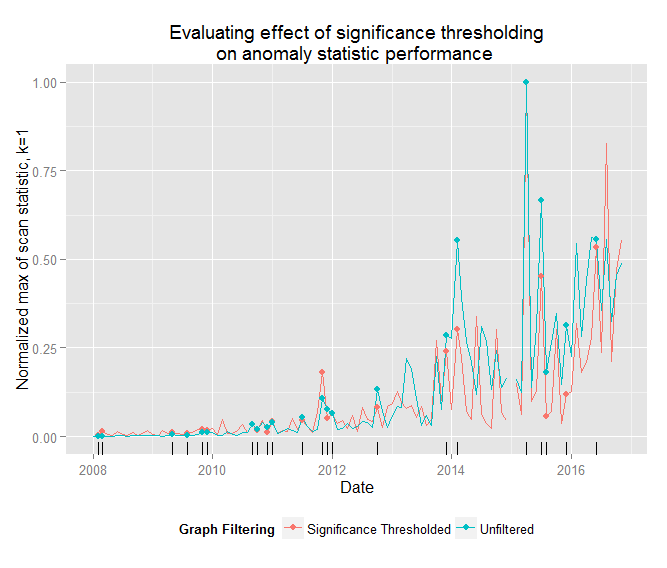
I’ve found that performing anomaly detection procedures on the significance graphs has similar or better results (qualitatively), which supports the the theory that these edges contain the bulk of the information relevant to identifying anomalous community behaviour. Let’s compare the results of applying the anomaly detection procedure using a edge count for the local scan statistic on order-1 neighborhoods (i.e. k=1) normalized against the previous two time periods (tau=2) on the reddit public comments dataset from January 2008 through November 2016.

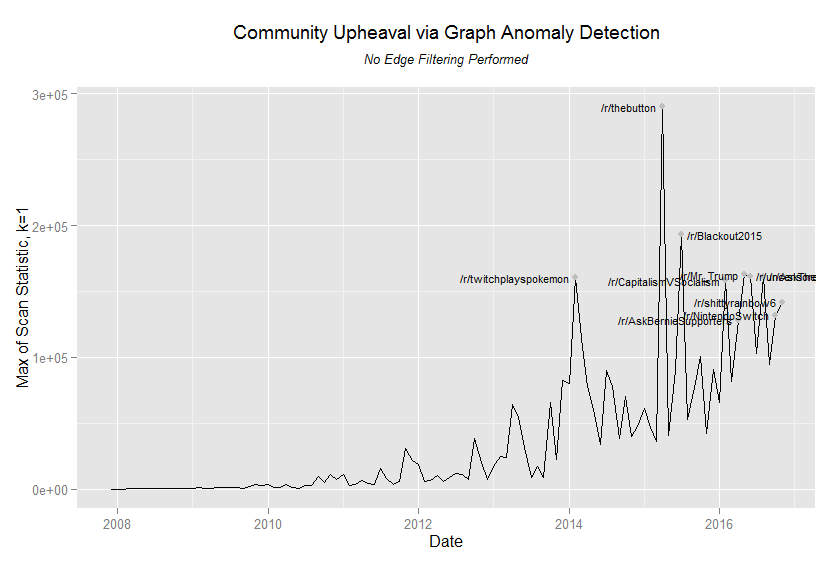
Because the graphs in the filtered dataset are much smaller we can’t compare the values of the scan statistics directly, but if we normalize the scan statistics relative to the max value we observed (after removing the January 2015 observation, which was a tremendous outlier in both datasets that I need to investigate) we see that the scan statistics performed very similarly. Despite the differences in the two data sets, the procedure identified the same anomaly locus in 22 periods. For the most part, the statistics agree about the most turbulent periods in the graph.
Let’s hone in on the results from the last two years of data and compare the results side by side. In the following table, “nexus anomaly” denotes the node in the graph (i.e. the subreddit) that had the highest value for the local scan statistic in that period.
| date | Anomaly Nexus (filtered) | Anomaly Nexus (unfiltered) | scan statistic (filtered) | scan statistic (unfiltered) | Normalized scan statistic (filtered) | Normalized scan statistic (unfiltered) | Does Anomaly Nexus Match? |
|---|---|---|---|---|---|---|---|
| 2015/02 | betterCallSaul | FeelsLikeTheFirstTime | 797 | 46823 | 15% | 16% | |
| 2015/03 | projecteternity | dnbhl | 332 | 36462 | 6% | 13% | |
| 2015/04 | thebutton | thebutton | 5285 | 290220 | 100% | 100% | X |
| 2015/05 | Boxing | UnitedColors | 527 | 40516 | 10% | 14% | |
| 2015/06 | fo4 | freegold | 689 | 89904 | 13% | 31% | |
| 2015/07 | Blackout2015 | Blackout2015 | 2386 | 193179 | 45% | 67% | X |
| 2015/08 | MensLib | MensLib | 299 | 52802 | 6% | 18% | X |
| 2015/09 | apple | Amd | 378 | 77305 | 7% | 27% | |
| 2015/10 | baseball | Nexus6P | 1603 | 100583 | 30% | 35% | |
| 2015/11 | JessicaJones | GGFreeForAll | 197 | 42558 | 4% | 15% | |
| 2015/12 | MakingaMurderer | MakingaMurderer | 627 | 90627 | 12% | 31% | X |
| 2016/01 | stevenuniverse | cssfuckfest | 668 | 65758 | 13% | 23% | |
| 2016/02 | thewalkingdead | CapitalismVSocialism | 1679 | 158323 | 32% | 55% | |
| 2016/03 | Defenders | ZombieSurvivalRP | 960 | 81655 | 18% | 28% | |
| 2016/04 | sweden | AskBernieSupporters | 1100 | 128069 | 21% | 44% | |
| 2016/05 | Battlefield | Mr_Trump | 1471 | 162830 | 28% | 56% | |
| 2016/06 | uncensorednews | uncensorednews | 2825 | 161728 | 53% | 56% | X |
| 2016/07 | TheSilphRoad | Incels | 1258 | 103127 | 24% | 36% | |
| 2016/08 | olympics | AskThe_Donald | 4378 | 161663 | 83% | 56% | |
| 2016/09 | southpark | CivilizationSim | 1112 | 94475 | 21% | 33% | |
| 2016/10 | westworld | NintendoSwitch | 2494 | 132032 | 47% | 45% | |
| 2016/11 | the_meltdown | shittyrainbow6 | 2932 | 141939 | 55% | 49% |
Again, we can see that the two approaches achieved similar results, especially in many of the most tumultuous periods. Concretely, the highlighted periods/subreddits that the filtered and unfiltered procedures agree upon are associated with the following events:
| Period | Anomaly Nexus | Event likely associated with the observed anomaly |
|---|---|---|
| April 2015 | /r/thebutton | Reddit’s 2015 April fools “prank” spawns a sprawling micro-community |
| July 2015 | /r/Blackout2015 | The firing of a Reddit employee triggers site-wide unrest in the form of protests and demonstrations of various kinds |
| August 2015 | /r/MensLib | Not gonna lie: I consider myself something of a Reddit historian at this point, but I have no idea what was significant about this community August 2015 |
| December 2015 | /r/MakingAMurderer | The Netflix series Making A Murder premiers to significant acclaim |
| June 2016 | /r/uncensorednews | The worst mass shooting in US history occurs at the Pulse Nightclub in Orlando |
There were, however, some important places where they disagree. The significance filtered approach seems to generally have had “better” hits:
| Period | Anomaly Nexus | Event likely associated with the observed anomaly |
|---|---|---|
| February 2015 | /r/betterCallSaul | Better Call Saul, the much awaited spin-off of Breaking Bad, is released |
| May 2015 | /r/Boxing | The Floyd Mayweather vs. Manny Pacquiao fight is the most anticipated boxing match in recent memory |
| October 2015 | /r/Baseball | The 2015 World Series occurs |
| November 2015 | /r/JessicaJones | The Netflix original TV series Jessica Jones is released to significant acclaim |
| April 2016 | /r/Sweden | Sweden’s housing minister resigns after comparing Israel to Nazi Germany |
| May 2016 | /r/Battlefield | The upcoming release of the video game Battlefield 1 is announced |
| July 2016 | /r/TheSilphRoad | The augmented reality game Pokemon GO! is released and quickly becomes the most used mobile app in the world |
| August 2016 | /r/Olympics | The Summer Olympics occurs |
| September 2016 | /r/Southpark | Season 20 of South Park commences |
| October 2016 | /r/westworld | The HBO series WestWorld debuts to significant acclaim |
| November 2016 | /r/the_meltdown | Donald Trump defies predictions and wins the US Presidential election |
There are a few cases where it looks like the unfiltered procedure had hits worthy of note not caught by the filtered procedure
| Period | Anomaly Nexus | Event likely associated with the observed anomaly |
|---|---|---|
| February 2016 | /r/CapitalismVSocialism | The ongoing US presidential election |
| April 2016 | /r/AskBernieSupporters | The ongoing US presidential election |
| May 2016 | /r/Mr_Trump | The ongoing US presidential election: in-fighting occurs in the larger community of Reddit’s Trump supporters |
| August 2016 | /r/AskThe_Donald | The ongoing US presidential election |
In all of these cases, this disagreement does not appear to suggest any fault or weakness on the part of the filtered version of the procedure: in all four of those periods, the filtered procedure honed in on a subreddit that was the focal point for a significant event in the community. There isn’t necessarily a single source of community tumult that is potentially of interest to us in a community as large, wide, and diverse as Reddit, so small variations in anomaly detection procedure can produce different but equally interesting results. I hope to share some of the results of additional modifications to the anomaly detection procedure in the near future (such as expanding the neighborhood beyond k=1 and using different local scan statistics).
Data compression
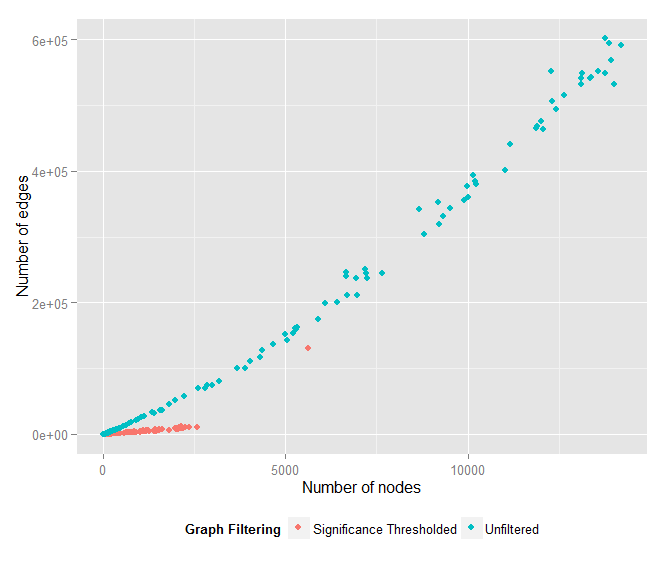
The “signficance graphs” resulting from this edge threshholding are orders of magnitude smaller – by edge count and positive-degree nodes – than their unfiltered counterparts.
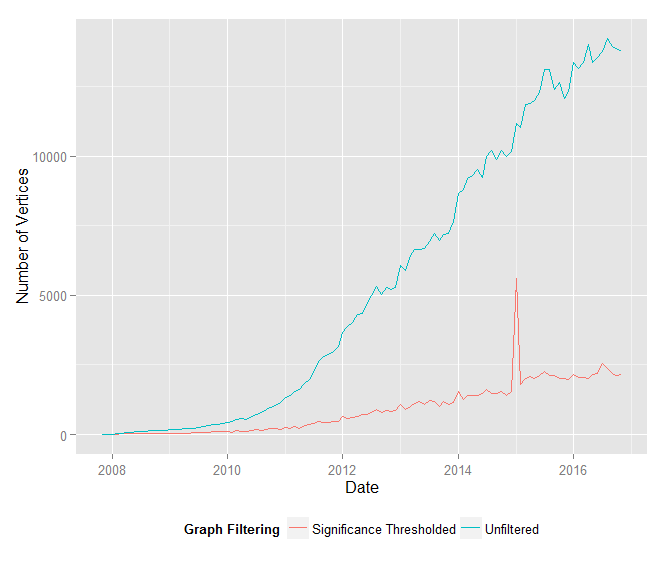
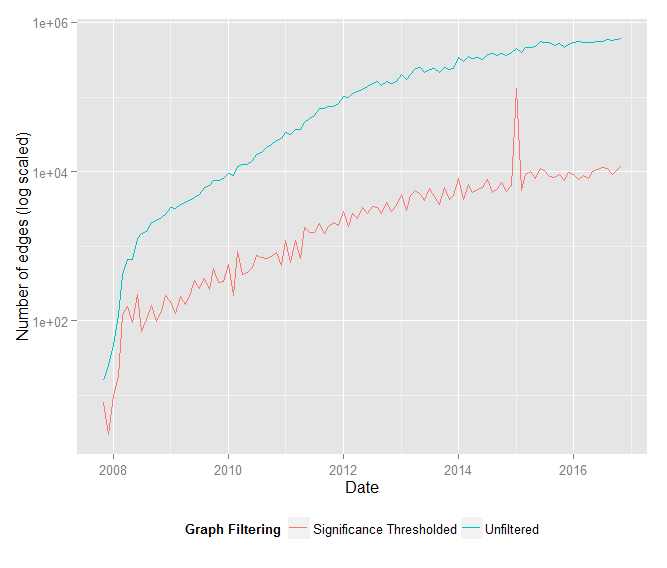
Additionally, the ratio of vertices to edges is roughly constant (approximately 0.245) in the filtered graph, whereas this ratio approaches zero as the graph grows in the unfiltered graph.
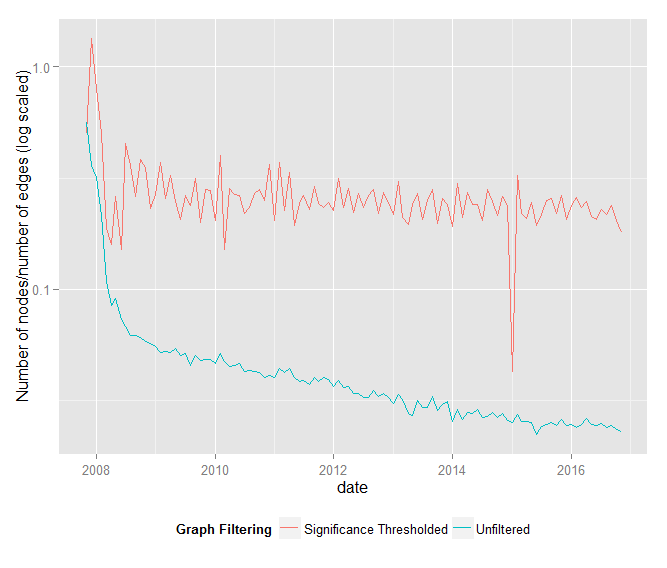
In other words, edge count grows linearly with node count in the significance graphs, but edge count grows much faster than node count in the unfiltered graphs.
Performance gains
Furthermore, because the filtered graphs are significantly smaller, the anomaly procedure is accomplished in seconds where it previously took several minutes, for first order local scan neighborhoods. Here are some performance comparisons between the significance filtered and unfiltered datasets (2007-2016, monthly graphs). All experiments performed on a conventional laptop (and for all experiments, tau=2):
| Procedure | Neighborhood order (k) | Time |
|---|---|---|
| Unfiltered | 1 | 3.5 minutes (215 seconds) |
| Unfiltered | 2 | Stopped after an hour |
| Unfiltered | 3 | Not attempted |
| Filtered | 1 | 40 seconds |
| Filtered | 2 | 44 seconds |
| Filtered | 3 | 46 seconds |
Conclusion
The application of binomial significance edge threshholding to the dynamic bipartite projection of a user-community social network results in a significant distillation of the information relevant to the anomaly detection task. The resulting sequence of graphs are orders of magnitude smaller, and the relationship between node count and edge count stabilizes to a linear relationship. This suggests that as node count increases, the relative performance gains from applying this procedure increase rapidly. This increased performance does not come at any noticeable cost to the quality of our results: in fact, it appears to improve the quality, which makes sense given that the justification for the thresholding we are performing is closely tied to the particular kinds of events we are hoping to detect.
Additionally, significantly reducing the edge count gives us much more flexibility in our ability to experiment with modifications to the anomaly detection procedure, as running local scan statistics on higher order neighborhoods (or even just playing with the particular local scan statistic we are using) becomes significantly more tractable on conventional hardware. A more complex anomaly detection procedure doesn’t necessarily ensure better results, but at least we now have the opportunity to experiment.