
(This is an article I wrote up 2/3/2016 but never got around to publishing. I’m post-dating it on the blog to place it in the appropriate timeline of my work, but I’m actually only just publishing this 1/4/2017. I hope to revisit this analysis and update it with more recent reddit data soon, in particular to analyze the effect of the 2016 US Presidential Eleciton on the reddit community)
Background
I’m interested in examining how the reddit community has been evolving over time. In particular, the community was in turmoil this summer in response to policy and personnel changes which had a significant impact on the reddit community, and I was curious to see if I could quantify the effects these events had on the community.
The Data
/u/Stuck_In_the_Matrix released a corpus of public reddit comments, which he has been updating monthly. Felipe Hoffa, of the Google Big Query team, made this dataset available on Big Query. I am thankful to them both for making this incredibly interesting dataset available.
Building a graph
A graph is a collection of entities (nodes) connected by relationships of some kind (edges). The reddit can be represented as a community where redditors and subreddits are nodes, and redditors are connected to subreddits by commenting activity. In this formulation, subreddits never connect directly to surbeddits, and redditors similarly never connect directly to redditors. This kind of graph, where there are two classes of nodes that are mutually never connected to each other is called a “bipartite” graph. We can “project” our bipartite graph into a unipartite graph by aggregating connections. Using this technique, we can form connections between subreddits by counting the number of redditors they are connected to in common.
User engagement on internet communities like reddit follows a 1-9-90 rule, which means that there are a lot of low actvitity users who will essentially be “noise” in our analysis. To clean up our graph, it’s helpful to focus only on the behaviors of “active users. For the purpose of this analysis, I’ve used a fairly liberal definition of “active”:
- A user is “active” in a subreddit if there were at least two submissions in that subreddit in which the user commented.
- A subreddit is considered active during a given time period if it has at least one active user during that month.
To mitigate the effect of bots and users promoting new subreddits (and to generally limit the effect that individuals can have on the overall community topology), I only considered edges with a weight of at least “2”.
Finally, I constructed a graph of this kind for each month in 2014 and 2015. By comparing changes in the graphs from week to week, we can learn a lot about how the community has been changing and even highlight periods of significant change.
Quantifying turmoil in the community with graph anomaly detection
By comparing how relationships between subreddits change over time, we can identify time periods during which the community at large is undergoing turmoil. Specifcally, we can apply “scan statistics” over the dynamic graph, giving us a measure of the chaos in the community at each time point and highlighting the subreddits that are the focal points of the tumult.
Methodological details for graph anomaly detection
One approach to this kind of anomaly detection was suggested by Priebe et. al. (2005) in their application of scan statistics to the Enron email network. Their problem was similar in that they were trying to identify time periods during which their network of interest was undergoing upheaval.
The approach is as follows: for each node in the graph, isolate its community out to some depth \(k\) (usually k=1 or 2). Then calculate some statistic over this subgraph, which we will call the “scan statistic.” The scan statistic used by Serrano is the sum of edge weights in the subgraph. We calculate the scan statistic for each node for each time step. Then, we standardize our observations by looking back across \(\tau\) timesteps. Finally, for each timestep we calculate the max value taken by the scan statistic for any node in that time period, and examine the distribution of this max over all time periods to identify anomalous time steps.
Graph anomaly detection results
The following plot can be interpreted as a quantification of the monthly “chaos”” in the reddit community over the last year.
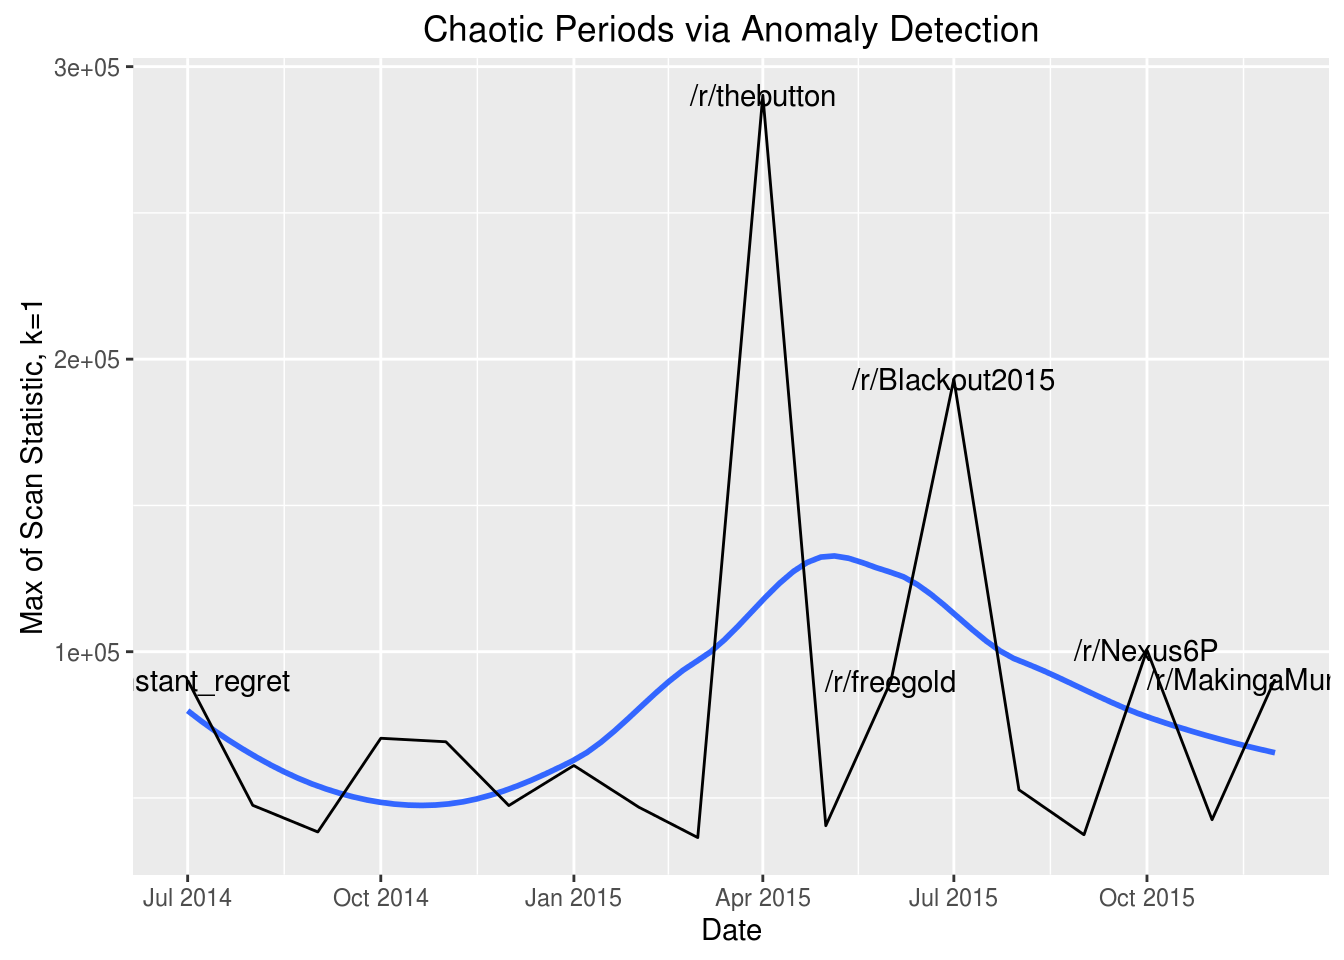
There are two very well defined spikes here, corresponding to chaos centering around the subreddits /r/thebutton in April, and /r/Blackout2015 in June. These spikes corresond to changes in redditors behaviros in response to the following events:
-
4/1/2015: The subreddit /r/thebutton is created for the annual April Fools joke, spawning a sprawling associated micro-community of about 20 new subreddits.
-
7/2/2015: Victoria is fired, resulting in the “2015 Blackout”. In response, a new subreddit, /r/ModSupport, was created to centralize mod-admin communication, and CEO Ellen Pao stepped down (a week later on 7/10/2015) to be replaced by Steve Huffman. Additionally, subreddits such as /r/Blackout2015 and /r/WatchRedditDie were formed to centralize expressions of frustration with the state of reddit and the behaviors of community members in leadership roles (volunteer moderators, or “mods”, and paid members of reddit staff, or “admins”).
I had expected a third event, the banning of /r/FatPeopleHate on 6/10/2015, to pop out as another source of significant comunity chaos, but it appears to have been overshadowed by the creation of the /r/freegold subreddit.
The Blackout
The graph anomaly detection presented above did a good job highlighting periods of significant chaos in the reddit community. One period that really stands out is the spike associated with the Blackout. A detailed history and description of the Blackout can be found here, so I won’t waste time providing background in this article. Just follow the link if you want the context.
In any event: in response to the Blackout, many users declared that they were fed up with reddit for various reasons, announced that they were abandoning reddit (many hoped to gain support for the reddit alternative Voat), and encouraged others to follow suit. For example, consider this manifesto posted by the then owner of the subreddit /r/CrappyDesign, announcing he was shuttering the subreddit for good (he was unsuccessful, the community convinced the admins to place someone new in charge).
It’s clearly evident that the Blackout was an extermely significant event in the reddit community (the most tumultous event in 2015, according to the data, and likely in reddit’s history if I were to allow my analysis to go further back).